We’re excited to announce Inspect Viz, a new data visualization framework for Inspect evals. Inspect Viz includes a variety of pre-built plots that provide commonly used views of eval data, making it easier to explore and communicate results from your evaluations.
Whether you need to visualize accuracy across tasks, compare model performance, or drill into specific evaluation runs, Inspect Viz provides ready-to-use components that work seamlessly with the Inspect ecosystem. Here are a few examples:
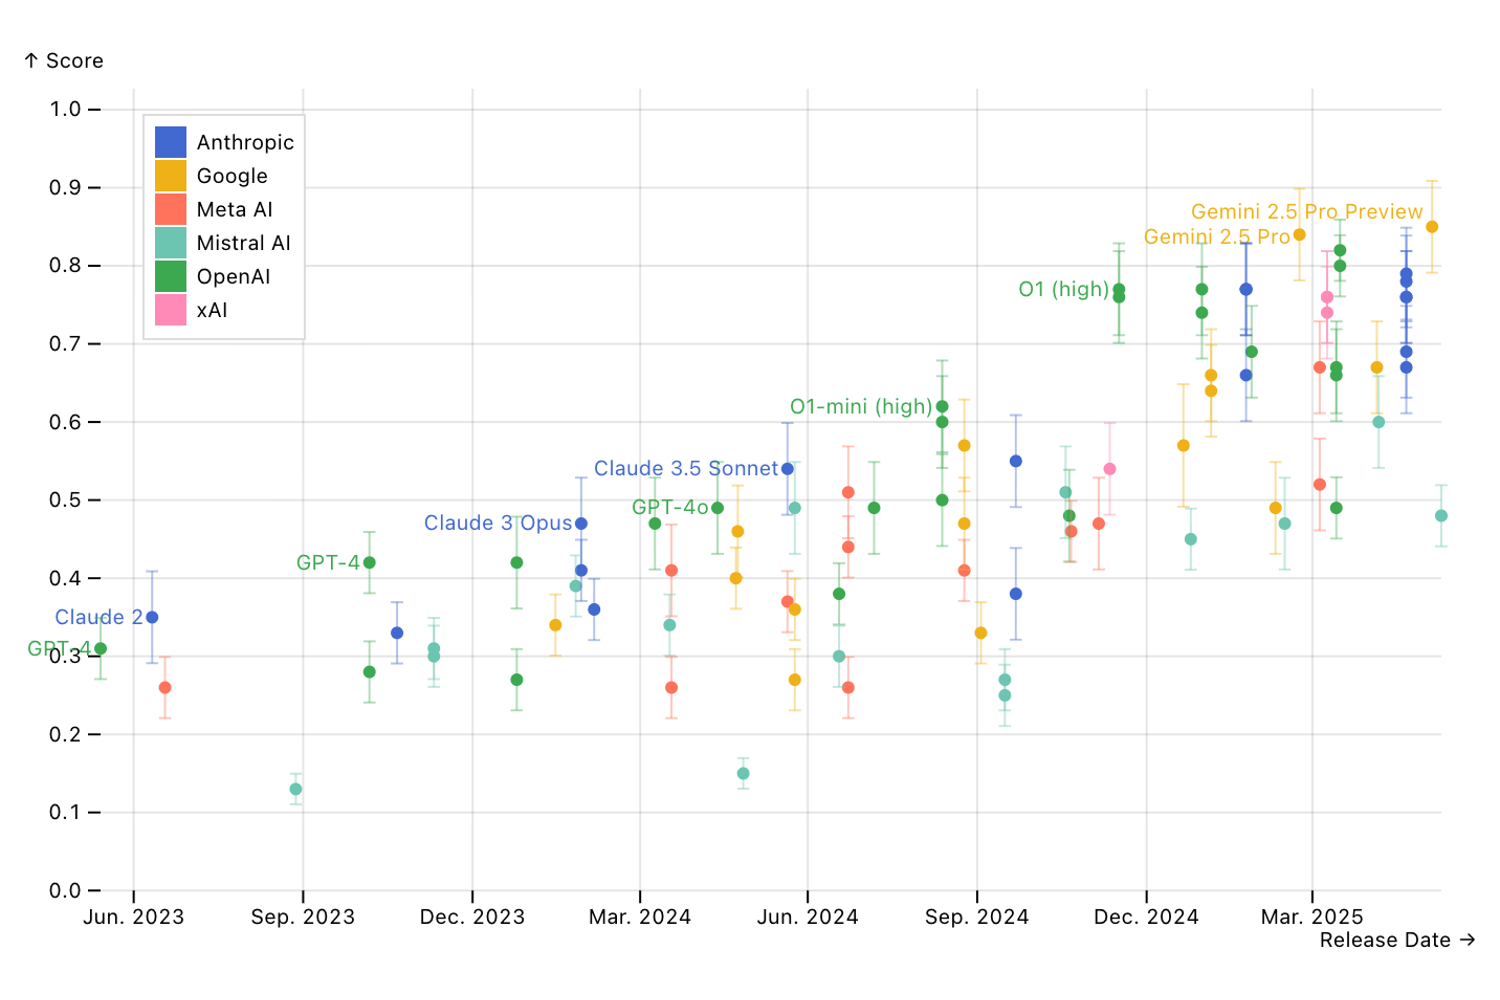
Track how model scores evolve over time across models and providers:
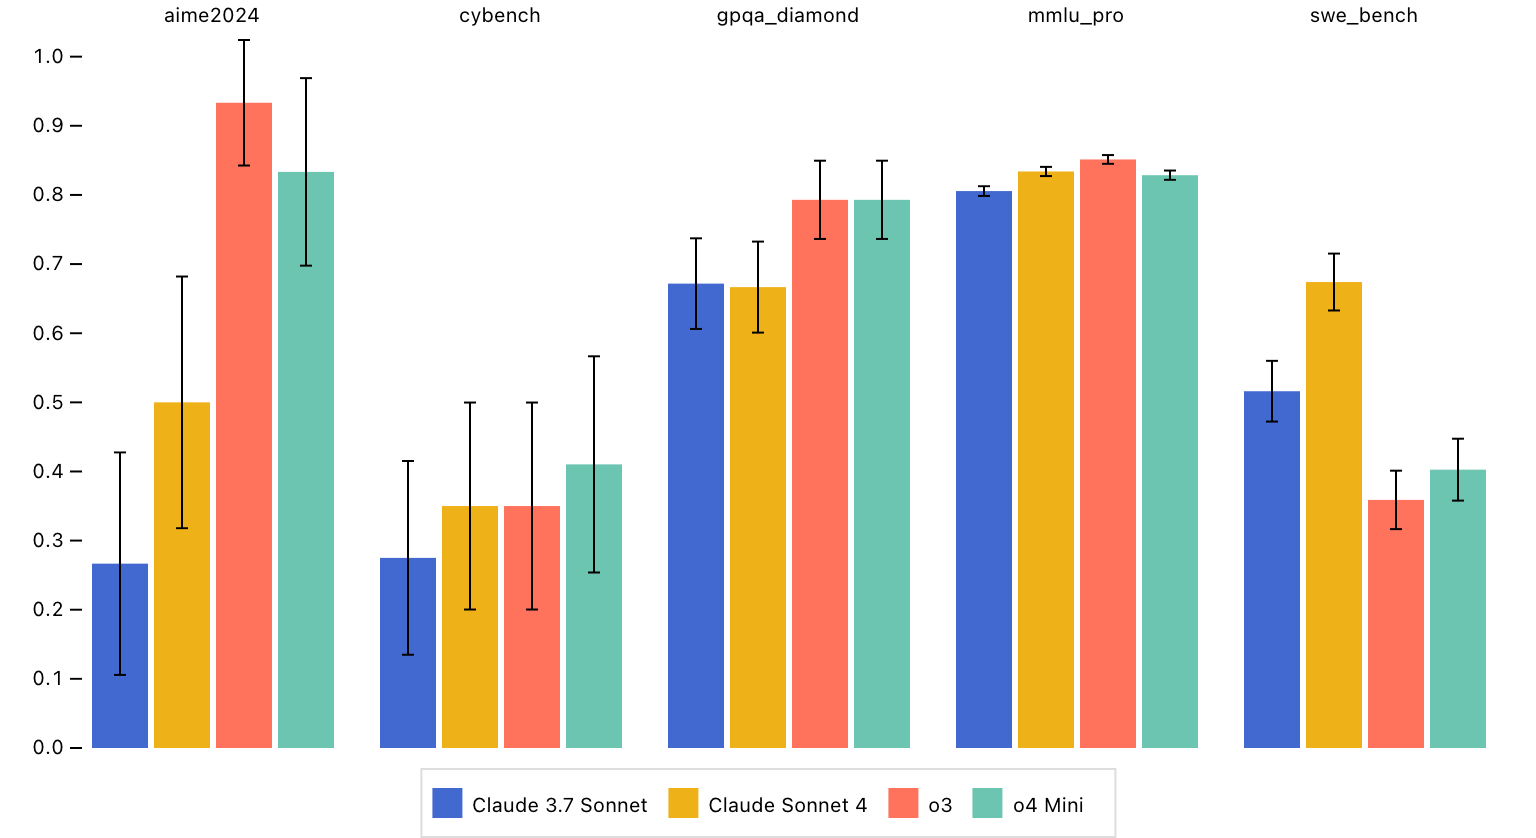
Break down evaluation scores by individual task to identify strengths and weaknesses:
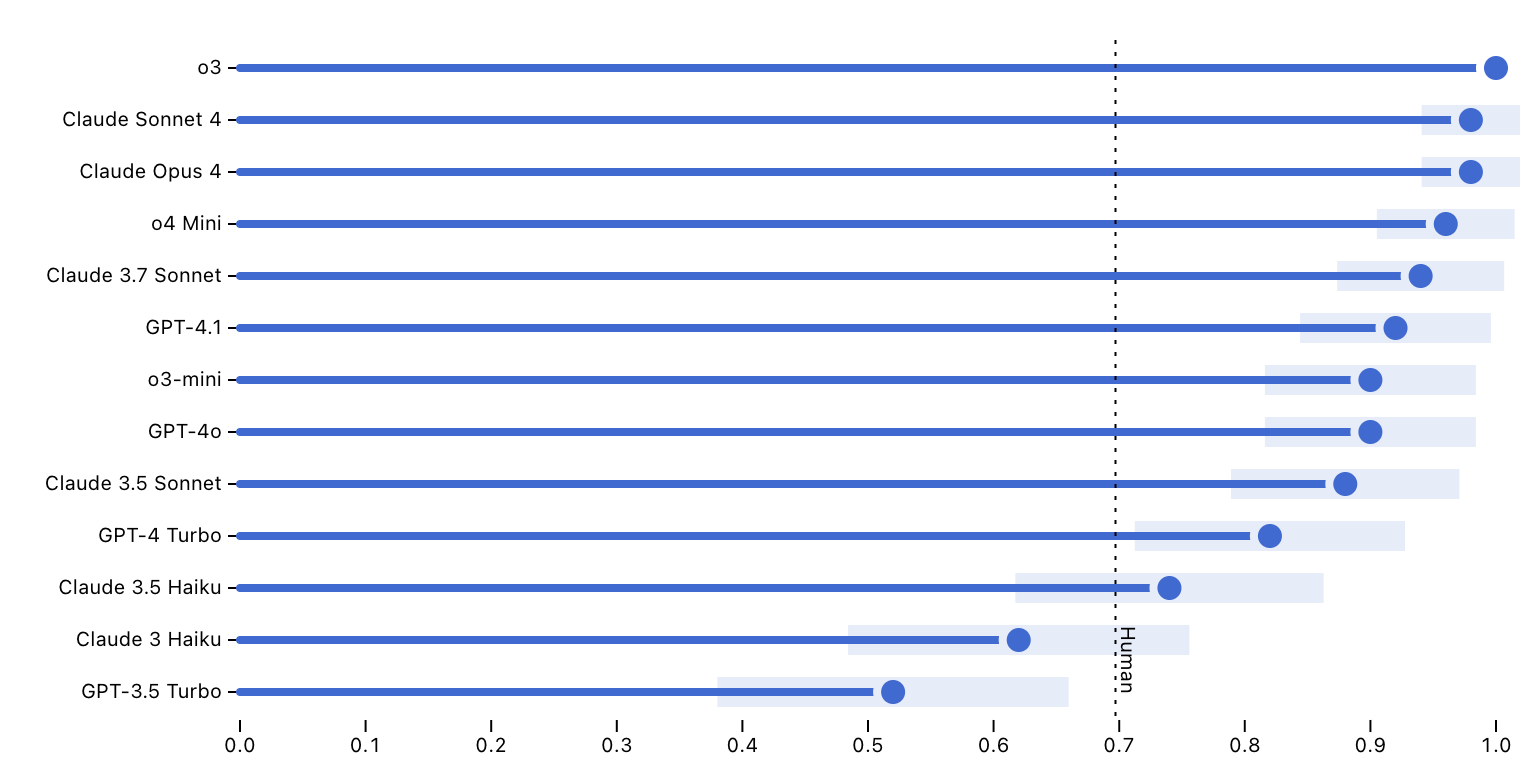
Compare performance across models at a glance:
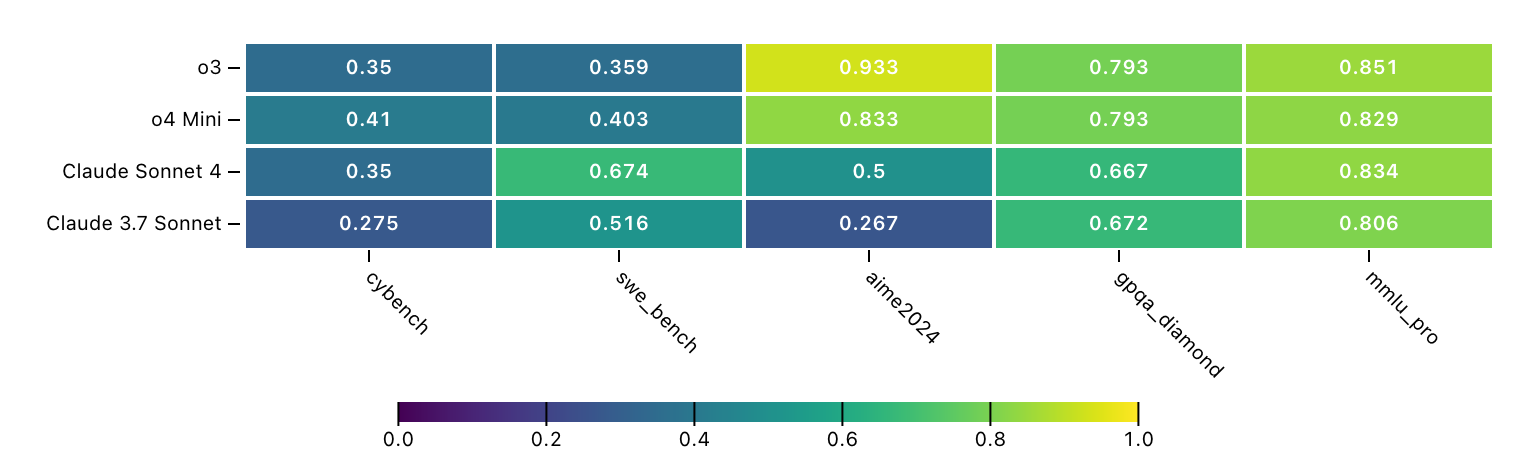
Use heatmaps to spot patterns across tasks and models simultaneously:
These are just a few of the views available out of the box and you can easily build your own custom visualizations on top of the framework. Get started with the Inspect Viz documentation.